Spreadsheet Package
MicroSoft Excel 2010
Concept: Spreadsheet Software
Spreadsheet is a program that accepts data in a tabular form and allows user to manipulate, calculate and analyze data in the desired manner. Two examples of spreadsheet software are: LOTUS 1-2-3 and Microsoft Excel.
Features of Spreadsheet
- Allows data entry, storage, calculations and presentation.
- Data validation for setting data entry rules.
- Formatting of data for making it attractive by using tools like font, font color, font size.
- Allow sharing workbooks, allowing multiple users to edit the same workbook at the same time.
Basic Fundamental of Spreadsheet
Workbook:
• Workbook is an Excel file that contains one or more worksheets. Each of the workbook’s worksheets are in separate tabs on the bottom of the Excel window. By default, a new Excel workbook will contain three worksheets.
Worksheet:
Worksheet is a single spreadsheet that contained cells organized by rows and columns. A worksheets begins with row number 1 and column A. Each cell contains number ,text of formula.
Cell:
The intersection between row and column is called a cell in which data can be stored. Only one cell can be active on time and is shown by a thick black border, which is called an active cell. A cell can contain 32000 characters.
Excel Data Types
The different types of data that MS-Excel recognizes are:
Text:
Text can include any combination of letters, numbers, and special characters.
Numbers:
While entering numbers, we can enter numbers from 0-9 and any of the following special characters: +, -, #, $, %, ^, &, *, !.
Logical:
Logical values TRUE and FALSE can be entered into cells.
Error:
Using formulas and functions can result in errors. An error value is a distinct type of data.
Understanding Range
A range is a rectangular group of connected cells. The cells in range may all be in one column, or one row, or any combination of columns and rows, as long as the range forms a rectangle. It is defined by the address of two opposite or diagonally paired corner cells separated by a colon (:).
Steps to select a cell or range using the mouse:
• To select a single cell, click it.
• Click the upper-left cell in the group and drag down to the lower-right cell to select additional cells.
• To select nonadjacent cells, press and hold the Ctrl key as you click individual cells.
• To select an entire row or column of cells, click the row or column header.
• To select adjacent rows or column, drag over their headers.
• To select nonadjacent rows or columns, press Ctrl and click the header for those you want to select.
Performing Calculation with formula
To enter a formula, do following:
a.Slect the cell in which you want the formula’s calculation to appear.
b. Type the equal to sign (=).
c. Type the formula. The formula appears in the Formula bar.
d. Press Enter to Complete formula.
To create formula using cell reference, do the following:
a. Select the cell where answer will appear.(B3 for example).
b. Type the equal sign (=)
c. Type the cell address that contain the first number in the equation (B1 for example).
d. Type operator you need for your formula.
e. Type the cell address that contains the second number in the equation( B2 for example).
f. Press Enter.
To create formula using the point and click method, do the following
a. Select the cell where answer will appear.(B4 for example).
b. Type the equal sign (=)
c. Click on the first cell to be included in the formula (A3, for example).
d. Type operator you need for your formula.
e. Click on the next cell in the formula (B3, for example).
f. Press Enter.
Performing Calculation with function
A function is predefined formula that performs calculation using specific value in a particular order.
The common functions used in MS-excel are:
| Function | Purpose |
|---|---|
| SUM | Adds all the numbers in a range of cells |
| AVERAGE | Return the average of the arguments |
| MAX | Return the largest value in a set of values |
| MIN | Returns the smallest numbers in a set values |
| COUNT | Counts the number of cells that contain numbers and numbers within the list of arguments |
| IF | Returns one value if a condition your specify evaluates to True and another value if it evaluates to False |
| AND | Returns True if all its argument are True; Returns false if the arguments are false. |
To use AutoSum to select Common Functions:
• Select the cell where the answer will appear.
• Click on the Home tab.
• Click on the Autosum dropdown arrow and select the function you desire.
• A formula will appear in the selected cell.
• Press Enter and the result will appear.
Chart in Excel
Charts are the pictorial representations of data. Some chart types available in MS-Excel are Colum chart, Line chart, Pie chart, Bar Graph, Area Chart, Scatter Graphs, Surface Charts, etc.
. Column Chart
The column chart is one of the most commonly used chart type and is used to show the changes in data over a period of time or illustrate comparisions among items.
. Line Graph
Line graphs are mainly used for plot changing in data over time. The best example of this chart type can be the weekly change in the temperature.
. Pie Chart
The pie chart is very useful when you wish to emphasize on a significant element in the data . It represents data in the form of a pie.
. Bar graph
A Bar Graph illustrates comparisons among individual items.
. Area Chart
An Area chart displays the magnitude of change over times.
. Scatter Graphs
The Scatter Graph and lines chart are almost similar, but the Scatter Graph is displayed with a scribble line whereas the Line graph uses connected lines to display data.
. Surface Charts
A surface charts come in handy if you are to determine the optimum combination between two sets of data.
Differences between bar chart and column chart.
The Difference between bar chart and column chart is:
| Bar chart | Column chart |
|---|---|
| 1. A bar chart illustrates comparisons among individual items. | 1. A Column chart show the changes in data over a period of time. |
To Create Chart:
• Type necessary data in the worksheet and select all the cells containing the data to include in the chart.
• Click on the Insert tab.
• Click on the desired chart type button in the Charts group.
• Click on the column button then, a list of column chart with sub types appears.
• Click the Clustered column chart sub-type.
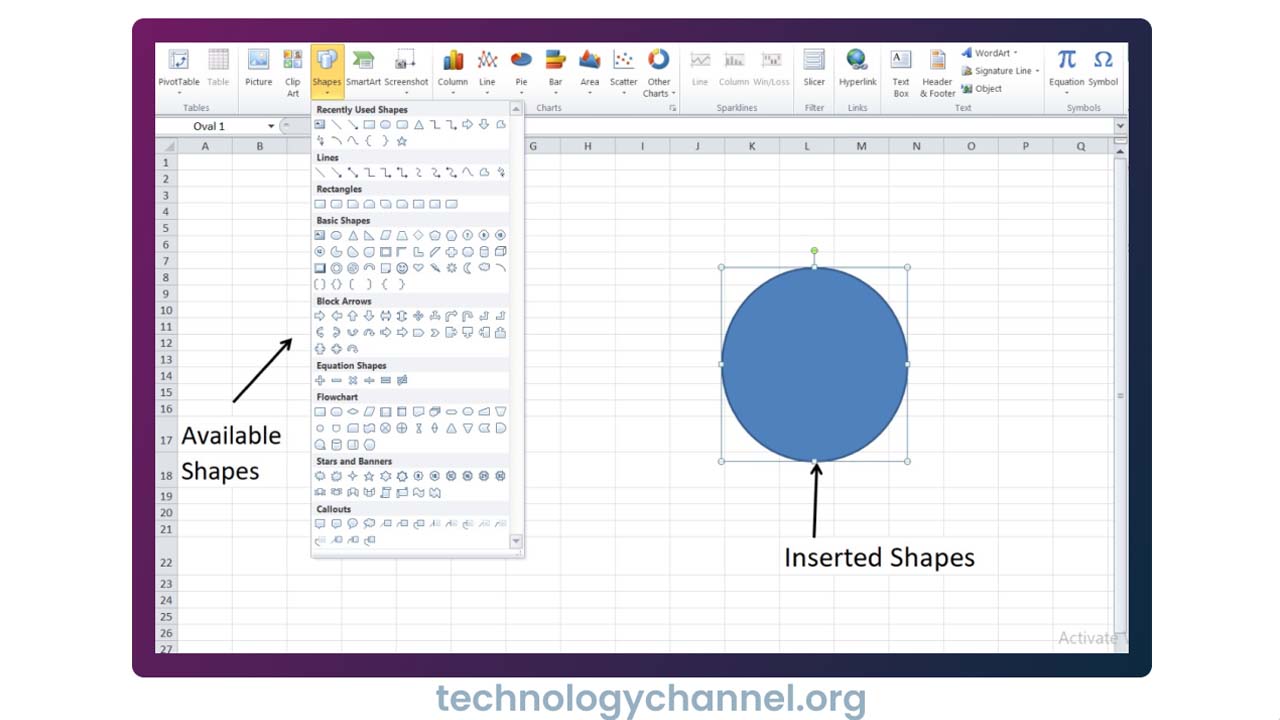
Insert Shape
- Choose Insert Tab » Shapes dropdown.
- Select the shape you want to insert. Click on shape to insert it.
- To edit the inserted shape just drag the shape with the mouse. Shape will adjust the shape.
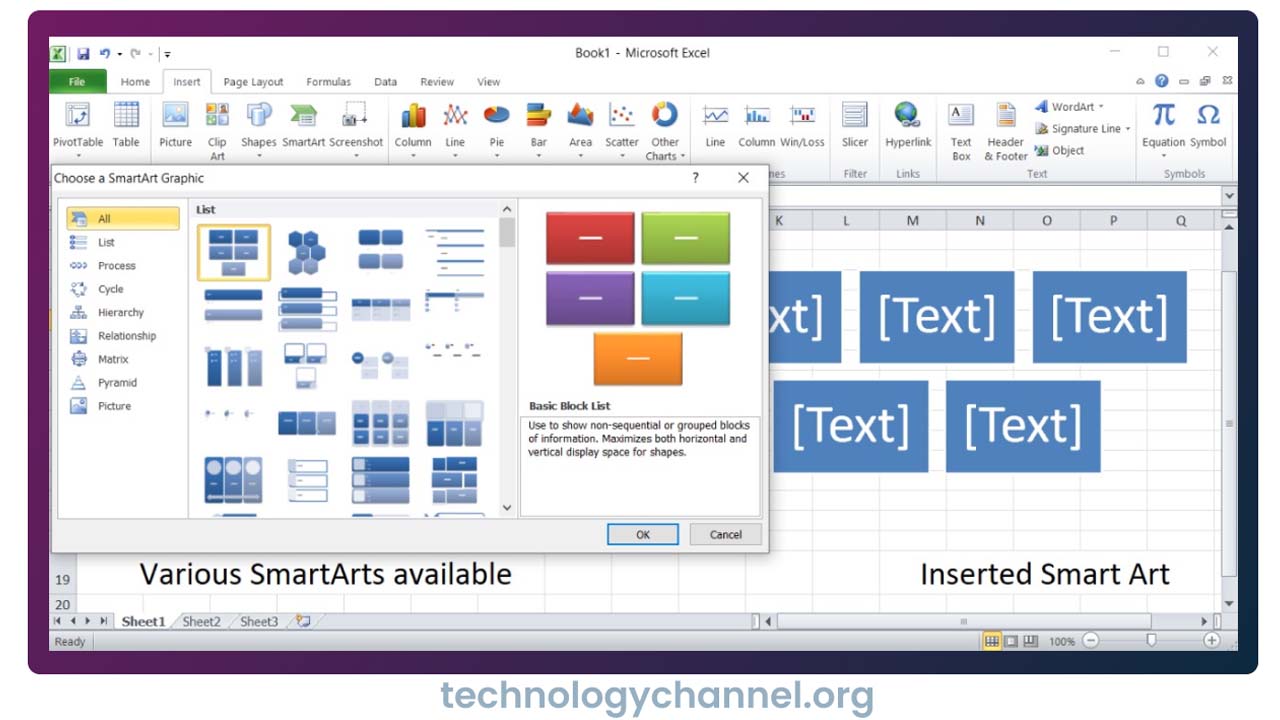
Insert smart art
- Choose Insert Tab » SmartArt.
- CLicking SmartArt will open the SmartArt dialogue as shown below in the screen-shot. Choose from the list of available SmartArts.
- Click on SmartArt to Insert it in the worksheet.
- Edit the SmartArt as per your need.
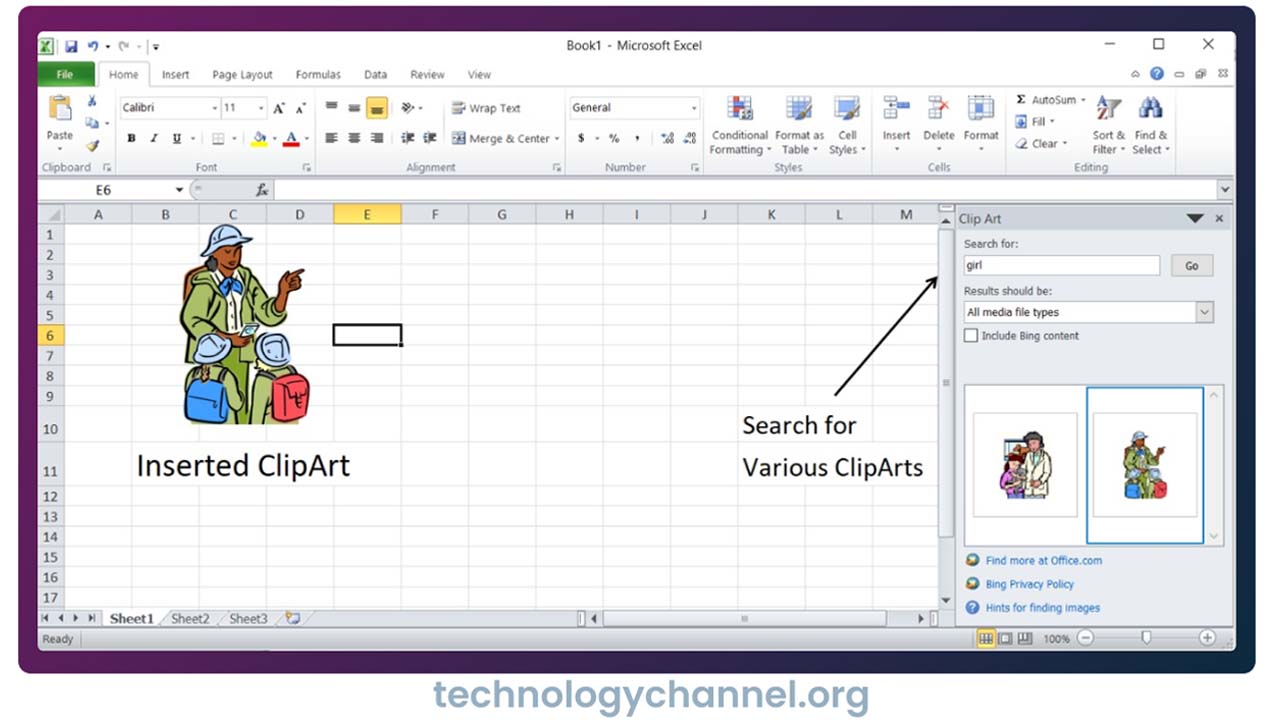
Insert Clip Art
- Choose Insert Tab » Clip Art.
- Clicking Clip Art will open the search box. Choose from the list of available Clip Arts.
- Click on Clip Art to Insert it in the worksheet.
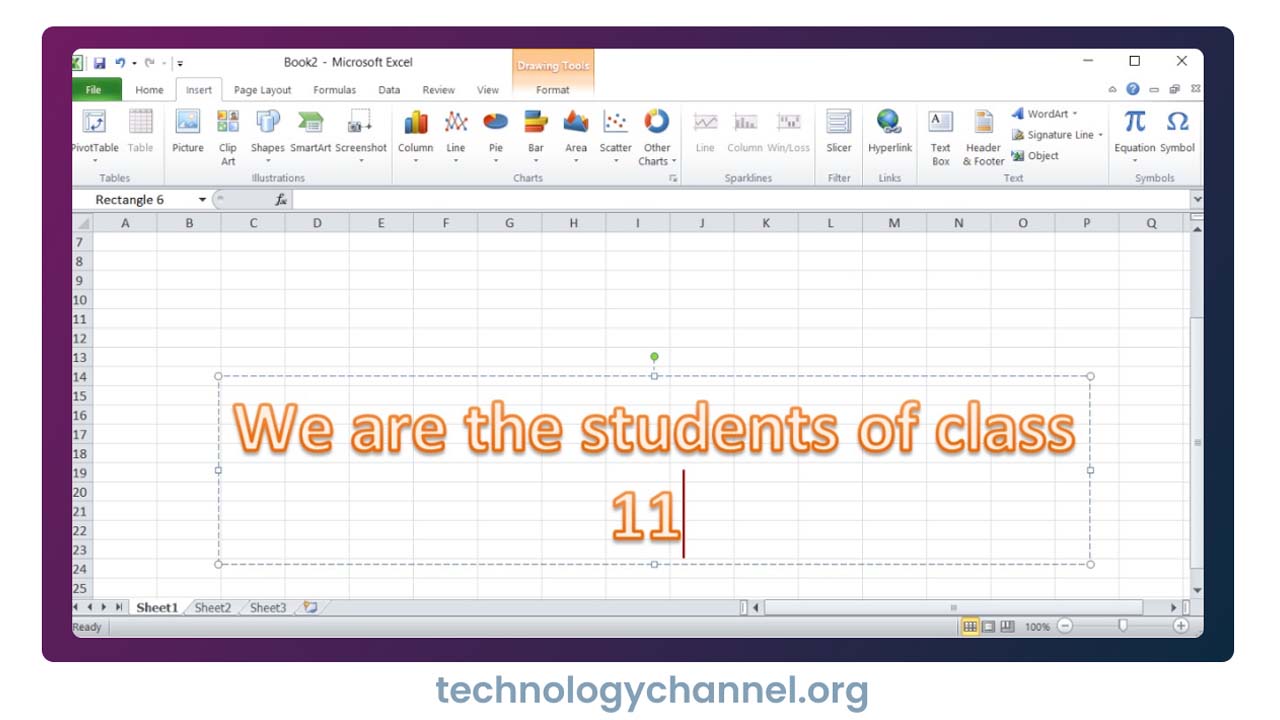
Insert World Art
- Choose Insert Tab » WordArt.
- Select the style of WordArt, which you like and click it to enter a text in it.
Printing from the Print panel
Printing with the Quick Print button is fine if all you want is a single copy of all the information in the current worksheet. If you want more copies or more or less data , then you need to print from the print panel in Excel 2010’s new backstage views.
Excel provides several ways to open the print panel
- Press Ctrl + P.
- Click the file tab and choose Print.
- Press Alt + F,P.
Cancelling a print job
1. Right click on the printer icon in the Notification area at the far right of the Windows task bar to open its shortcut menu.
2. Select Open All Active printers from the shortcut menu.
3. Select the Excel Print Job that you want to cancel in the list box of your’s printer’s dialog box.
4. Choose Document-> Cancel from the menu bar, and then click Yes to confirm that you want to cancel the print job.
5. Wait for the print job to disappear from the queue in the printer’s dialog box and then click the Close button.
Data Series
A data series is a row or column of numbers that are entered in a worksheet and plotted in your chart, such as a list of quarterly business profits.